

Our process
Use Machine Learning To
Identify a Fraudulent Bank Transaction

Understand our Dataset
With Python, we used Pandas and visualization libraries to conduct an Exploratory Data Analysis (EDA) to find meaningful relationships in our data.

Clean our Dataset and Find Correlations
After preforming our EDA, we distilled our data set to six features and one target. Depending on our current sample, various rows were removed due to duplicates or NaN data.

Code Machine Learning Models and Produce Conclusions
We split our data set and successfully trained it on ten different classification models supported by the Sci Kit Learn library, accurately creating a model to predict fraud in each.
Size of Original Data Set
Models
Hours Of Work
Hard Workers
Features
Features Used for Predictions

amount
oldbalanceOrg
newbalanceOrig
oldbalanceDest
newbalanceDest
type
Libraries used for conducting Exploratory Data Analysis
With Python's data analysis library: Pandas, we read in our dataset with the "read_csv" method into a data frame. Afterwards, we manipulated our data frame to solely hold features relevant to our model learning.
Syntax
import pandas as pd
Methods/Class Variables:
- pd.read_csv()
- df.head()
- df.info()
- df.drop()
- df.dropna()
- df.reset_index()
- df.columns
- df.dtypes
Plotly express allows us to us to create multiple visualizations for representing different columns in our dataset.
Syntax
import plotly.express as pt
Methods/Class Variables:
- pt.imshow()
- pt.histogram()
- pt.pie()
- pt.scatter()
- pt.density_heatmap()
- pt.imshow()
- pt.box

Visualizations
What do you see in our data?
- All
- Scatter
- Histogram
- Heat Maps
- Pie Charts
- Box Plots
Machine Learning Models
The following are models we have used to train our dataset and conduct predictions
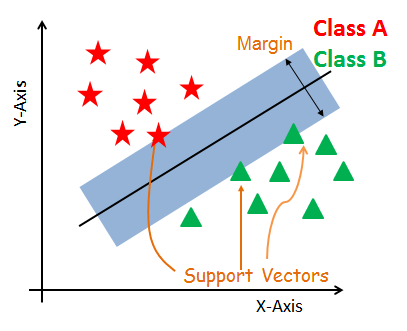
Support Vector Models
Support Vector Machines takes on a classification approach and the model is built on a multidimensional space which helps separate different classes. The objective is to segregate a data set into a hyperplane, and fit the data while having the highest margin.
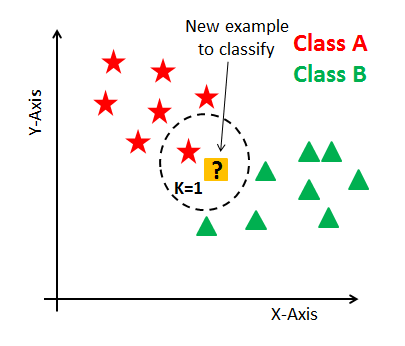
Read MoreK-Nearest Neighbors
K-NN is a supervised Machine Learning algorithm that predicts similarity between new data and available data and can be used for regression and classification.
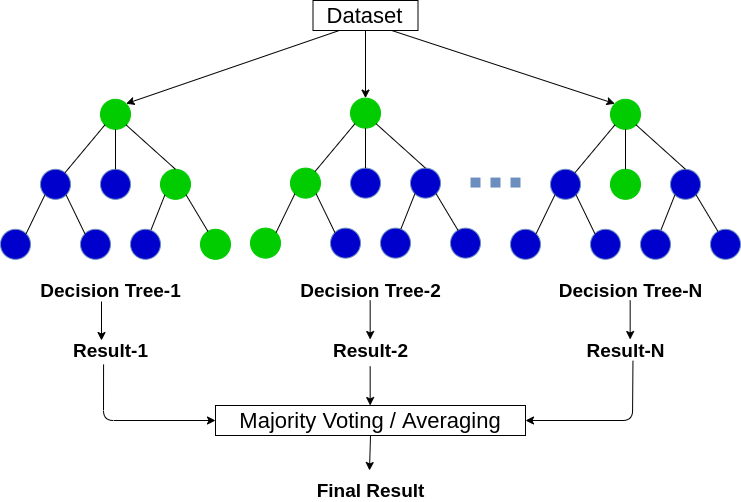
Read MoreRandom Forest Classification
Random Forest creates decision trees on selected data, collects a prediction from each tree, and then selects the prediction with the most votes (occurrences) as the final prediction.
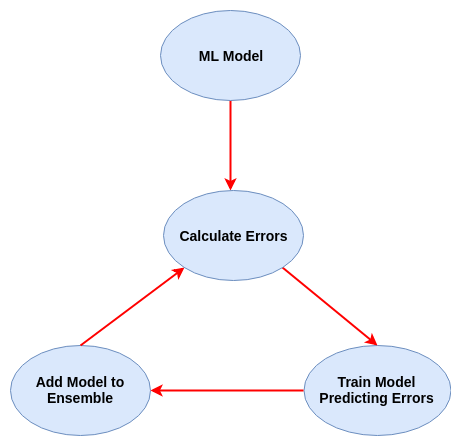
Read MoreXGBoost
Extreme Gradient Boosting, is a scalable, distributed gradient-boosted decision tree (GBDT) machine learning library. It provides parallel tree boosting and is the leading machine learning library for regression, classification, and ranking problems.
Read MoreLogistic Regression
A logistic regression model predicts a dependent variable (binary outcome) by analyzing the relationship between multiple independent variables.
Read MoreNaive Bayes
Naive Bayes is a classification model which calculates the probability of given class labels then finds the likelihood probability of each attribute. The model then repeatedly inputs these values into Bayes formula, choosing the class with the highest probability.
Read MoreConclusions
What we got out of each model:
In general, many of these top machine learning models yielded very similar results with extremely high accuracies that the differences were pretty negligible.
Overall Result
Conclusion
The Support Vector Machine Learning model has an accuracy score of 0.99939984, roc_auc_score of 0.666666. SVM yielded 19,977 True Positives,0 False Positive, 12 True Negative, and 6 False Negative.
Support Vector Machine Learning
Conclusion
K-Nearest-Neighbors has an accuracy score of 0.9994498624656164, roc_auc_score of 0.69444444. The model yielded 11 False Negatives, 7 True Negatives, and 19977 True Positives, and 0 False Positive.
K-Nearest Neighbors
Conclusion
XGBoost has an accuracy score of 0.9998258345428157 and a roc_auc_score of 0.9285714285714286. The model yielded 3 False Negatives, 18 True Negatives, 17204 True Positives, and 0 False Positives.
XGBoost
Conclusion
The Random Forest Model has an accuracy score of around 0.999899 and a roc_auc_score of 0.972197. The model yielded 19,976 True Positives, 1 False Positive, 17 True Negative, and 1 False Negatives.
Random Forest Classification
Conclusion
Team
Our hard working team

Asad Shahid
Technical Expert and GitHub EnjoyerNo Pressure, No Diamonds

Engoron Lim
Decision-Maker and DebuggerCorgi is love. Corgi is life.

Jayden Cavanagh
Graphic Designer and Project ManagerAvogadro's number 6.02214076 x 10²³. Now why is the sky blue?

Ray Parikh
Frontend Developer and Design LoverAn apple a day keeps anyone away if you throw it hard enough.

Shruti Vora
Data DissectionPurpose Fuels Passion

William Ruan
Communications and OrganizerThey said to follow my dreams, so I went back to sleep.

Katherine Vo
Instructor and Cal Academic AdvisorA Weighted Blanket is not enough, I need to be compressed into a .zip file